A park in Jiaxing has carried out in-depth "look back" and upgrading standards for the construction of a "non-direct sewage discharge area", comprehensively investigated the sources of water pollution, strengthened the standardized management of water and drainage for enterprises in the park, strengthened monitoring and control, and piloted digital and intelligent management models to improve The water environment quality of the rivers around the park, promoting water ecological restoration, etc., need to complete the relevant acceptance work of the benchmark park in 2022.
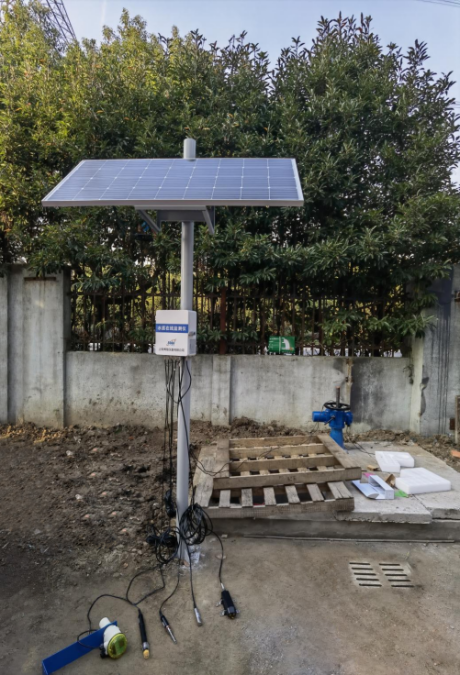
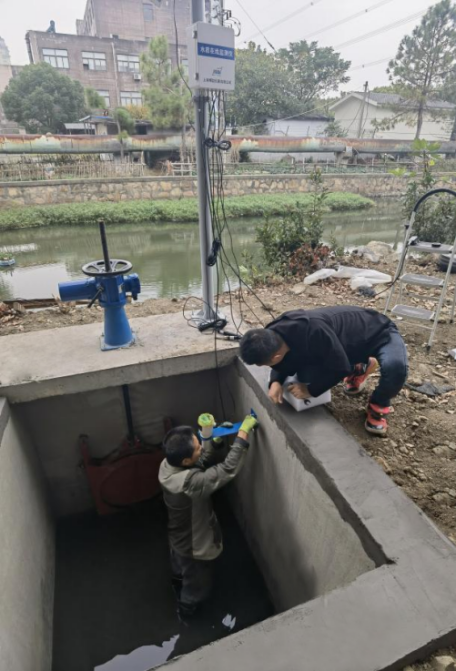
The project construction includes the rectification of some enterprises' rainwater pipe networks (including new equipment installation wells and blocking of rainwater drainage outlets); the procurement and installation of 15 sets of rainwater drainage outlet gates; the installation of 16 sets of enterprise rainwater drainage outlet monitoring terminals; and a comprehensive rainwater drainage supervision platform Build an equipped operating environment; install a buoy station equipped with cameras at key nodes; and build a set of smart drains at the rainwater drains in the food park.
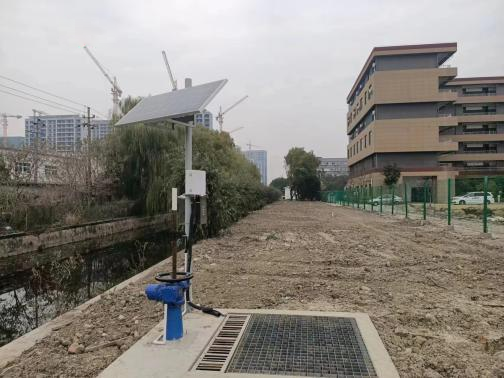
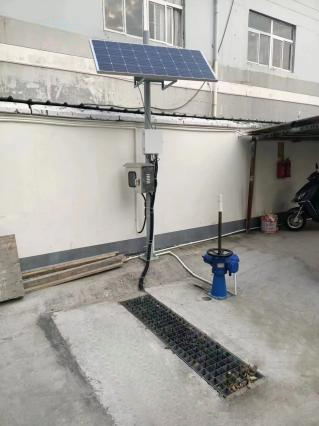
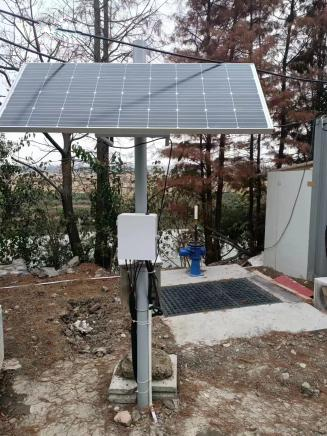
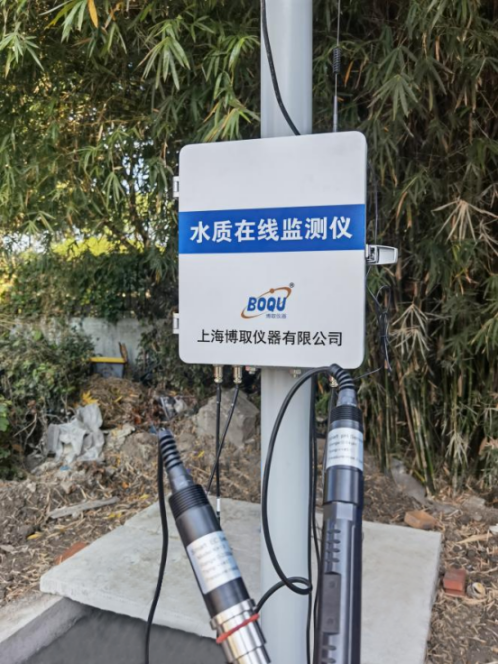
Monitoring Parameters:
Monitoring rainwater level (ultrasonic level)
Conductivity (Digital Sensor)
pH Value (Digital Sensor)
Pipe pressure (static pressure)
Rainwater pipe network flow velocity (Doppler)
Valve potential monitoring (DTU remote control)
After the construction of the comprehensive rainwater drainage monitoring platform is completed, the monitoring data of the rainwater drainage outlets of enterprises in the industrial agglomeration area will be synchronized to the platform, giving supervisors a visual overview of the basic situation of rainwater drainage facilities, pollution sources, and drainage households in the jurisdiction. For example: the total number of pollution sources and their partition distribution, the number and online status of IoT devices, trend changes in monitoring indicators, etc. At the same time, the platform will present early warning information in a timely manner to facilitate coordination and management to promptly open the stop valve, check the pipeline condition, and prevent contaminated rainwater from flowing into municipal rainwater pipes and rivers.
Product advantages/equipment features:
1. Dual carbon concept, low power consumption and no energy consumption;
2. Use mains power or solar lithium battery for power supply;
3. Monitoring Parameters: pH, suspended solids, COD, ammonia nitrogen,
conductivity, flow, liquid level and other parameters;
- Data output standard RS485 protocol, which can be sent remotely through wireless modules such as RTU;
- The sensor has calibration and self-cleaning functions, no reagents, and low maintenance.
System Advantage:
1. Platform homepage: The main screen of the entire rainwater drainage comprehensive monitoring platform can provide supervisors with a visual overview of the basic situation of rainwater drainage facilities, pollution sources, and drainage households in the jurisdiction. Such as the total number of pollution sources and their partition distribution, the number and online status of IoT devices, trend changes in monitoring indicators, etc.
2. Map display: Display rainwater facilities, pollution sources, distribution of drainage households and real-time monitoring information in the form of a map.
3. Real-time data: Detailed operation data of drainage facilities and equipment are displayed in the form of cards. You can also click to view detailed operation information of the site, such as historical monitoring data, alarm information, operation reports, etc.
4. Video surveillance: Can access on-site video surveillance signals and retrieve on-site video surveillance images in real time.
5. Alarm management: When the monitoring data exceeds the normal range, the system automatically forms an alarm log and issues an alarm prompt. You can quickly locate the alarm monitoring point and view detailed alarm information.
6. Trend analysis: The collected data can be stored, historical operation trend curves can be drawn, and various indicators of each site can be customized and selected, and one or more panels can be used for comparative viewing and analysis.
7. Operation reports: You can view the running reports of each site, customize the corresponding data indicators, and compare reports and trend analysis.
Post time: May-16-2025
